We ♥ Graphs (December & Final 2011 Edition).
January 4, 2012
2011 is in the books.
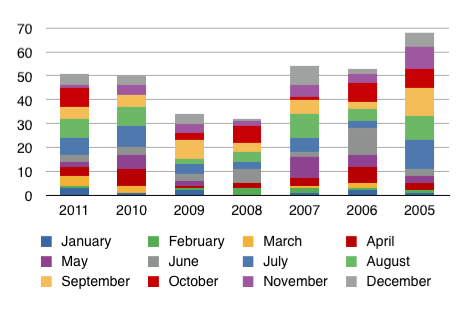
Here’s the December and final graph that compares 2011 year to date completed sales activity for all transactions on Lake Vermilion (including homes, cabins, and lots) since 2005.
As shown, 2011 finished one transaction short of 2010. (Wait! See updates below.) A 2011 sales total greater than 2010 do not materialize due to the fact that 5 Lake Vermilion pending sales failed to close by December 31st. Those sales will, most likely, be logged early in 2012.
I had hoped for an improvement so we could see a clean trend in the recovery of our local market. But… as with the broader economic picture, the recovery process is tracking at a slow and deliberate pace.
In a day or two, I will post a few additional graphs to close out the 2011 sales year. Plus, a new file will begin for 2012!
Please let me know if you have any questions about this information. Your comments are welcome, too. Thanks for visiting.
Update! Apparently we have had an after-the-deadline addition to the number of Lake Vermilion closed sales logged into the 2011 calendar year. This brings the 2011 total to 50 closed sales which is exactly the same as 2010. We can now officially say the trend has not been reversed. Whew.
Up-update! Apparently we have had another after-the-deadline addition to the number of Lake Vermilion closed sales logged into the 2011 calendar year. This brings the 2011 total to 51 closed sales which is one more than 2010. We can now officially say the upward trend is intact. Double whew.
 Bill Tibbetts
Associate Broker


