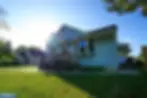
A daily journal concerning Lake Vermilion and surrounding areas.
Selected real estate, notes, stories, musings, and anecdotes.

Comparative Lake Vermilion YTD Sales (Final 2023)

January 8, 2024

Deja vu.

The 2023 Lake Vermilion real estate market was very similar in overall and final activity levels to 2022. 67 total sales. Again. That’s a middle of the road number for this, largely recreational property, real estate market.

We are certainly past the aberration years associated with the pandemic but, similar to 2022, there were factors tugging the market in conflicting directions throughout the year. Overall economic factors (real or perceived), interest rates, and certainly inventory levels remained in play as market influences.

It’s difficult to quantify the impact of ongoing reduced inventory levels. If more homes and land were offered for sale would more active buyers be available in the marketplace? That’s tough to say because, for one thing, there’s no measurement for the number of buyers who did not purchase due to their inability to find a desirable listing.

End of year numbers show these notable results: average selling price continues to increase (an unsurprising long term trend), average listing days on market dropped by 50%, selling prices compared to latest asking price did not change significantly (most Lake Vermilion sales complete with a negotiated and reduced final selling price).

Here are the actual numbers comparing Lake Vermilion (all property types) Final 2022 versus Final 2023:

  • Completed sales – 67 sales versus 67 sales
  • Average selling price – $433,173 versus $465,031 (Median selling price = $345,000 versus $439,500)
  • Average days on market – 183 days versus 96 days
  • Closed sales above asking price – 16 sales versus 8 sales (23.8% versus 11.9%)
  • Closed sales at the asking price – 7 sales versus 16 sales (10.4% versus 23.8%)
  • Closed sales below the asking price – 46 sales versus 43 sales (68.6% versus 64.2%)

So what’s anticipated for the 2024 Lake Vermilion real estate market? I am happy to copy and paste my comment on 2023 as an appropriate and, hopefully, accurate comment for 2024. “I believe the amount of available inventory will, again, have the biggest impact on market activity. If inventory remains low and buyer interest remains solid, sellers may benefit with a continuing upward trend in market values. The number of successful transactions will be determined by how many buyers find an acceptable offering from a lower number of available properties.”

Please let me know if you have any questions or comment with this information. Thanks for visiting!

(As always, the grey lines show previous years and the red line represents 2023 data.) (All data was sourced from the Range Multiple Listing Service.)

Comparative Lake Vermilion YTD Sales (Final 2022)

February 9, 2023

As first glance, 2022 might appear as an under performing market year for the Lake Vermilion market, especially if compared to the previous 2 years (2022 and 2021). However, as the graph might suggest, 2022 was more of a typical year in terms of completed total sales. 2022 saw 67 completed Lake Vermilion transactions.

Buyer enthusiasm seemed to be in place throughout the 12 months of 2022. And sellers with decent offerings priced at reasonable asking prices did, for the most part, find willing buyers.

However, as mentioned and suggested in the mid-year post, the most significant limiting factor in the final sales number was, most likely, the amount of available inventory.

As shown in the following numbers… the average selling price was up, the time to sell was flat, and most sales were below the asking price (although in most of these transactions the final agreed upon price was just slightly below the asking price).

Comparing Lake Vermilion (all property types) Final 2021 versus Final 2022 shows the following:

  • Completed sales – 109 sales versus 67 sales
  • Average selling price – $387,401 versus $433,173 (Median selling price = $300,000 versus $345,000)
  • Average days on market – 186 days versus 183 days
  • Closed sales above asking price – 11 sales versus 16 sales (10.0% versus 23.8%)
  • Closed sales at the asking price – 16 sales versus 7 sales (14.6% versus 10.4%)
  • Closed sales below the asking price – 82 sales versus 46 sales (75.2% versus 68.6%)

So… what can be expected in the 2023 Lake Vermilion market? I believe the amount of available inventory will, again, have the biggest impact on market activity. If inventory remains low and buyer interest remains solid, sellers may benefit with a continuing upward trend in market values. The number of successful transactions will be determined by how many buyers find an acceptable offering from a lower number of available properties.

Please let me know if you would like additional details on this information.  Thanks much.

(As always, the grey lines show previous years and the red line represents 2022 data.) (All data was sourced from the Range Multiple Listing Service.)

Comparative Lake Vermilion YTD Sales (First Half 2022)

August 18, 2022

Twelve months ago I used the word “enthusiasm” to describe the Lake Vermilion real estate market through the first half of the year.

This current graph might lead one to conclude that “enthusiasm” would be an inappropriate descriptor for YTD 2022. However, the “don’t jump to conclusions” adage might be applied here.

I would suggest that, through July 2022, overall buyer enthusiasm was present only to be throttled by the restriction of unusually low available inventory levels (which is revealed in the reduced number of closed sales).

Comparing Lake Vermilion (all property types) YTD 2021 versus 2022 shows the following:

  • Completed sales – 47 sales versus 28 sales
  • Average selling price – $283,376 versus $426,339 (Median selling price = $235,309 versus $285,250)
  • Average days on market – 223 days versus 273 days
  • Closed sales above asking price – 4 sales versus 8 sales (8.5% versus 28.5%)
  • Closed sales at the asking price – 8 sales versus 4 sales (17% versus 14.2%)
  • Closed sales below the asking price – 35 sales versus 16 sales (74.4% versus 57.1%)

The market performance for the second half of 2022 is a tough prediction.

Factors contributing to overall activity will include over all economic performance and perception, mortgage rates (recently higher but historically very low), and, of course, the inventory of available properties.

Please let me know if you would like additional details on this information.  Thanks much.

(As always, the grey lines show previous years and the red line represents 2022 data.) (All data was sourced from the Range Multiple Listing Service.)

Comparative Lake Vermilion YTD Sales (Final 2021)

January 21, 2022

The strong activity and enthusiastic interest in Lake Vermilion waterfront property was made obvious as the 2021 calendar year progressed. The number of monthly closed transactions were at record levels from January through December (as noted on the updated chart below).

Here are the numbers:

The 2021 Lake Vermilion market logged a total of 109 sales (that’s +8 from 2020 which was also a record breaking year). The total dollar amount sold was $42,226,808 (+$4,847,258 from 2020) with an average sale amount of $387,401 (+$17,307 from 2020).  (These numbers include sales for all property types… homes, cabins, year round, seasonal, vacant lots, road access, water access, and a couple of riverfront properties.)

I would suggest that 2021 could have produced additional sales if not for the constraint of low inventory. There were not enough properties for sale to meet the level of buyer interest.

It is curious, however, that in a market reasonably described as “seller oriented” (where sellers found excellent buyer interest and reduced time to sell) most of the completed sales were negotiated below the asking price. In fact, 75% of the 2021 Lake Vermilion sales were below the advertised asking price. 15% of the completed sales were at the asking price and 10% were above the asking price.

2022 should see continued strong buyer interest. However, as noted above, lower than typical inventory could dampen the potential for third straight record year. Also, if this combination persists, it would reasonable to expect 1) a market that favors the seller and 2) upward pressure on market values.

At this writing, to date in 2022, there are 5 completed and pending sales.  That compares to 9 sales at this time in 2021.

Stay tuned. Stay safe.  See you on the lake.

(As with all previous graphs, the grey lines show prior years and the red line represents 2021 data.)

(As always, the grey lines show previous years and the red line represents 2021 data.)(All data was sourced from the Range Multiple Listing Service.)

Comparative Lake Vermilion YTD Sales (First Half 2021)

August 2, 2021

As is obvious in this latest graph, the enthusiasm seen in the Lake Vermilion real estate market in the second half of 2020 has continued into the first half of 2021.

There were 47 completed sales (all property types) through June with an average selling price of $283,376.  The selling price range was from $34,000 to $1,250,000.  The average “days on market” for that group was 223 days.

There is plenty of general real estate conversation about a “seller oriented market”.  Indications of this imbalance include low inventory, immediate multiple offers for newly listed properties and final selling prices above the advertised listing price.  Curiously, the 47 sales to date in the 2021 Lake Vermilion market included only 4 sales above the most recent asking price and only 8 sales at the most recent asking price.  All other sales were below asking price.

The second half of 2021 will see the impact of low inventory levels with active buyers unable to act due to a smaller than typical listing selection.  (Completed sales in July 2021 are more inline with historical numbers.)

Please let me know if you have any questions or comments with this information.  Thanks for your time.

(As always, the grey lines show previous years and the red line represents 2021 data.)(All data was sourced from the Range Multiple Listing Service.)

Comparative Lake Vermilion YTD Sales (Final 2020)

January 19, 2021

I have to put an asterisk on the year 2020*.  I think it’s safe to say 2020* be will asterisk heavy for all of time… for numerous widely known reasons.

Look at this 2020* year end graph (see below).

As is obvious, 2020* broke all previous real estate activity records in the Lake Vermilion market.  Land, cabin and home properties were snapped up by anxious buyers who, apparently, were largely driven by the attraction of an up north refuge removed from the pandemic, politics, and other people.

Here are the numbers:

The 2020* Lake Vermilion market logged a total of 101 total sales (that’s +12 from 2015 and +16 from 2016). The total dollar amount sold was $37,379,550 (+$12,901,868 from 2019) with an average sale amount of $370,094 (+$25,338 from 2019).  (These numbers include sales for all property types… homes, cabins, year round, seasonal, vacant lots, road access, water access.)

This increased activity pushed a market that, for several years, has not significantly favored buyer or seller to a market with a seller advantage.  Increased buyer activity reduced the pressure for sellers to negotiate pricing.  The inventory of active Lake Vermilion listings eroded throughout the calendar year to where, at this point in time, inventory numbers are at very low historical levels.

In my post from one year ago (see below) I got one 2020* expectation wrong and one right:

“The buyer and seller mix and level of motivation on both sides should remain mostly balanced with no significant change expected in seller inventory or buyer interest.”  WRONG.

“As always, larger factors on the state, national or global stage may come into play.”  RIGHT.

Again, as a teaser for the coming 2021 market… January 2021, to date, has produced 9 completed and pending sales.  We’ll have to see if that strong start continues throughout the year.

Stay safe.  See you on the lake.

(As with all previous graphs, the grey lines show prior years and the red line represents 2020 data.)(All data was sourced from the Range Multiple Listing Service.)

2020* = 2020

Comparative Lake Vermilion YTD Sales (First Half 2020)

July 6, 2020

Many year to date conversations with buyers and sellers in the 2020 Lake Vermilion area real estate market have, at some point, come around to this common inquiry:

“Is the current Lake Vermilion real estate market being affected by:  a) the Covid 19 pandemic  b) social unrest  c)  politics  d)  any combination of these 3 current events?

Individuals involved in this market professionally and for profit probably offer varied responses to these questions.  My response, to date, has been “It’s too early to tell, at least from a closed transaction measurement.”

The year-to-date chart noted below shows a trend currently within historical numbers.  The largest factor so far has been the sluggish start in the first three months of the year that occurred largely before the noted events had become daily headlines.  The reason or reasons for the small number of early closed sales is anyone’s guess.

The second half of the year will, as always, reveal the full story.

I do see that the number of pending sales, at this writing, are near typical numbers.  That fact might suggest that these greater issues may not have a large impact on the 2020 Lake Vermilion area market.

That’s not a call.  We’ll have to see how it plays out… hopefully with an overall sense of future optimism.

(As always, the grey lines show previous years and the red line represents 2020 data.)(All data was sourced from the Range Multiple Listing Service.)

Comparative Lake Vermilion YTD Sales (Final 2019)

February 3, 2020

2019 can now formally be referred to as “recent history”.

Market activity for the first half of the year suggested strong performance with a shot at near record annual sales. However, completed sale numbers after the summer months lapsed into the “less than stellar” category which resulted in a year end performance similar to 2018.

The 2019 Lake Vermilion market logged a total of 71 total sales. The total dollar amount was $24,477,682 with an average sale amount of $344,756. (These numbers include sales for all property types… homes, cabins, year round, seasonal, vacant lots, road access, water access.)

At this point in time, there is no indication the typical factors that normally affect this local real estate market will be influential in 2020. The buyer and seller mix and level of motivation on both sides should remain mostly balanced with no significant change expected in seller inventory or buyer interest. As always, larger factors on the state, national or global stage may come into play.

As a teaser for the coming 2020 market… January 2020 produced 6 completed sales. That broke a record for the month that has been in place for 15 years. (Of course, one point of data really isn’t a significant indication of anything.)

(As with all previous graphs, the grey lines show prior years and the red line represents 2019 data.)(All data was sourced from the Range Multiple Listing Service.)

Comparative Lake Vermilion YTD Sales (First Half 2019)

July 8, 2019

It’s 2019 and we are half way through the calendar year.  The year to date activity in the local real estate market is very similar to 2018.  My comments from one year ago are applicable to this year:

“Mid summer sale totals are not necessarily a great indicator of the final calendar year market performance.  This mostly recreational market typically logs more completed sales in the second half of the selling season.

Having noted that and as is obvious in this edition of the graph… year to date 2018 is lagging behind other recent years.  However, it appears mid summer activity has increased to the point where lost ground may be regained in the next few months.”

At this point in time it’s fair to label this update a “Summer Rerun”.  The next few months will reveal either a  familiar, or, perhaps, a surprise ending.  Check back soon.

(As always, the grey lines show previous years and the red line represents 2019 data.)

(All data was sourced from the Range Multiple Listing Service.)

Comparative Lake Vermilion YTD Sales (Final 2018)

February 19, 2019

The 2018 Lake Vermilion real estate market finished with 72 completed sales.

There is a minor trend observed since 2015 with successively fewer sales each year during that four year time frame… 89/2015, 85/2016, 75/2017, 72/2018.

The total dollar amount for sales in 2018 was $23,227,050.  The average sales amount for that group was $322,597.  Both of those numbers increased slightly from 2017 despite 3 fewer transactions.

2018-2019 brought Lake Vermilion a bonafide winter with subzero temperatures and ample snow for outdoor fun.

As a reminder… the historical average ice out date for the lake is April 30th.  That’s only 70 days to get ready for your Lake Vermilion summer.  Get on it.

And stay tuned.

(As always, the grey lines show previous years and the red line represents current year data.)(All data was sourced from the Range Multiple Listing Service.)

Older Posts »