November 4, 2010
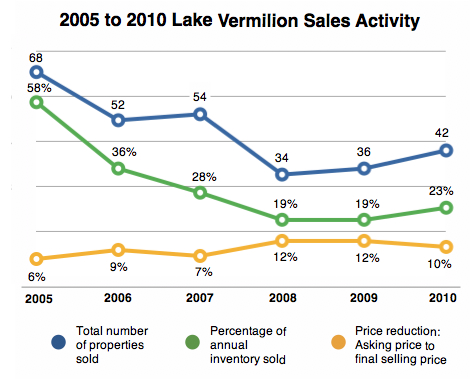
Here’s one more graph that illustrates real estate sales activity for Lake Vermilion over the last 5+ years.
The data was sourced from the local MLS System and it reflects all closed property sales with “Vermilion” noted as the waterfront name. Each year reflects the total 12 month period except for 2010 which, of course, is year to date.
Please draw your own conclusions. And contact me if you would like additional information.
 Bill Tibbetts
Associate Broker


