December 29, 2010
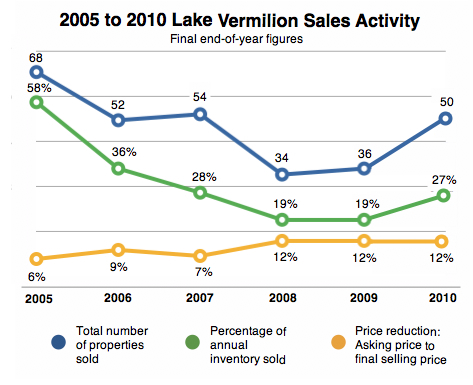
Here’s an updated version of the graph shown below (posted in early November 2010). This graph represents final 2010 end-of-year Lake Vermilion real estate sales compared to previous years.
As noted before, the data was sourced from the local MLS System and it reflects all closed property sales with “Vermilion” noted as the waterfront name.
I would note the nice rebound in sales and the continued steady and unchanged selling price discount accepted by the Sellers. Is this an indication some Buyers are finally reacting to a lakeshore market offering never anticipated lower prices? Hmm.
Please contact me if you would like additional information.
 Bill Tibbetts
Associate Broker


