We ♥ Graphs (August 2011 Edition).
September 6, 2011
Turning the corner!
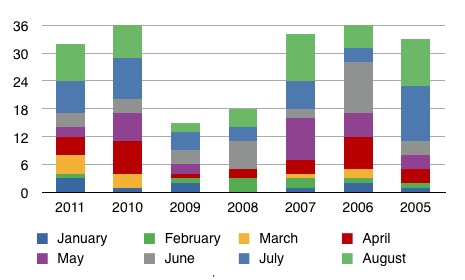
Here’s the August graph that compares year to date completed sales activity for all transactions on Lake Vermilion (including homes, cabins, and lots) since 2005.
August 2011 was a historically typical month. Comparatively, there were no significant changes from July.
I would describe August as a posturing month. This race will be won or lost in the next two months. I know this… 2005 had breakaway sales activity late in the selling season. It’s tough to see any year, including 2011, keep pace with 2005.
I will offer this prediction. 2011 will pass 2010. If so, I say it’s a good indication the local real estate market continues to steadily and very gradually improve to historically normal activity levels.
Please let me know if you have any questions about this information. Your comments are welcome, too.
 Bill Tibbetts
Associate Broker


