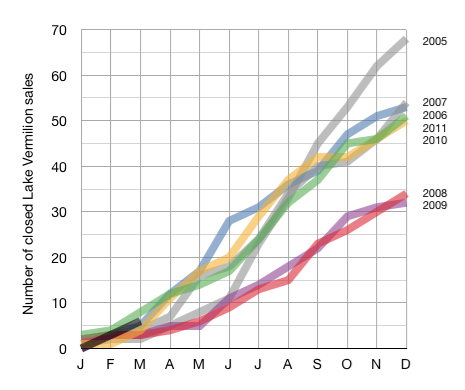
Comparative Lake Vermilion Sales YTD Through March.
April 3, 2012
Here’s the March monthly installment for year to date completed real estate sales on Lake Vermilion.
Again, year to date sales for 2012 are represented by the short black line on the bottom left of the graph.
It’s really too early in the year to use this information to predict activity in the coming months.
Let’s see what April brings. I know there are several pending sales in the works that should bump the April number.
 Bill Tibbetts
Associate Broker


