A daily journal concerning Lake Vermilion and surrounding areas.
Selected real estate, notes, stories, musings, and anecdotes.

A Little Off The Top.

June 28, 2012

Here’s a graph to confirm an unsurprising fact.

At this writing, there are 109 cabins and homes (road and water access) offered for sale on Lake Vermilion.  This chart shows the current asking price (grey line) and the corresponding original asking price (red line) for individual properties priced from $100,000 to $1,000,000.  (Information sourced from the Range MLS data.)

1) Obviously, Sellers continue to offer price adjustments to attract Buyers.  2) Aged listings will, typically, have a greater degree of asking price adjustment.  Most newly listed properties will reflect pricing adjusted to changing market conditions.  3) The remainder of the story is revealed after the final selling price is established.

The Best Lakes Contain Water.

June 14, 2012

It’s raining.

“So what!”…you might think.  Well, not so many weeks ago, the extended lack of rainfall/snowfall was made very evident by the water level of the lake.  We were in an elevated drought status with dry soils and an unusually low lake water level.  However, over the last several weeks, we have had an ample amount of local precipitation.  The additional rainfall has allowed for a Lake Vermilion water level recovery.  To confirm, you can view the  DNR trend here (click on the graph to see the details).

It’s interesting to also note the water levels on other Minnesota lakes.  Leech Lake, Winnibigoshish, and Cass Lake have similar patterns to Lake Vermilion.  Lake Mille Lacs has had a longer sustained downward pattern.  The trend on Lake of the Woods is very stable.  Lake Minnetonka also has a similar pattern to Lake Vermilion but with a wider water level range of 8+ feet (versus Lake Vermilion’s 3 1/4 feet).

Water… it’s what makes a lake.

Update:  Some areas in NE Minnesota are getting way too much rain.

A Good Question.

June 8, 2012

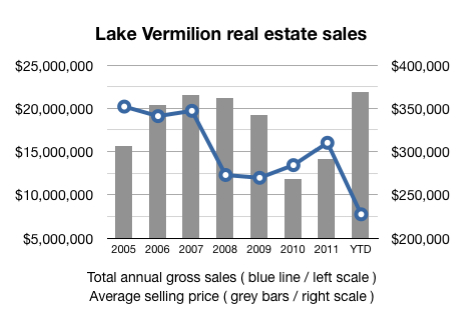
A few days ago, valued reader Andy asked for information on annual gross sales for Lake Vermilion.

Here’s a graph (we love graphs) that shows total annual gross sales from 2005 to date plus average sale price for each year. This is Lake Vermilion only. I hope other visitors find this information useful or, at least, interesting. Please let me know if you have any questions.

Thanks, Andy!

(Data from Range Multiple Listing Service.)

Comparative Lake Vermilion YTD Sales Through May.

June 5, 2012

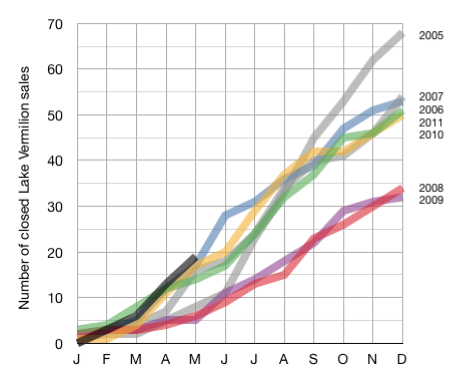
Here’s the May monthly installment for year to date completed real estate sales on Lake Vermilion.

(Year to date sales for 2012 are represented by the shorter black line on the bottom left of the graph.)

We’re 5/12ths into 2012.  At this point in time 2012 has surpassed the closed sales activity of the any of the previous seven years (not by much but a lead is a lead).

The high expectation months of June, July, and August are up next.  Will 2012 remain the sales leader?  Will Buyers and Sellers continue to work cooperatively to find mutually acceptable agreements?  Stay tuned.