A daily journal concerning Lake Vermilion and surrounding areas.
Selected real estate, notes, stories, musings, and anecdotes.

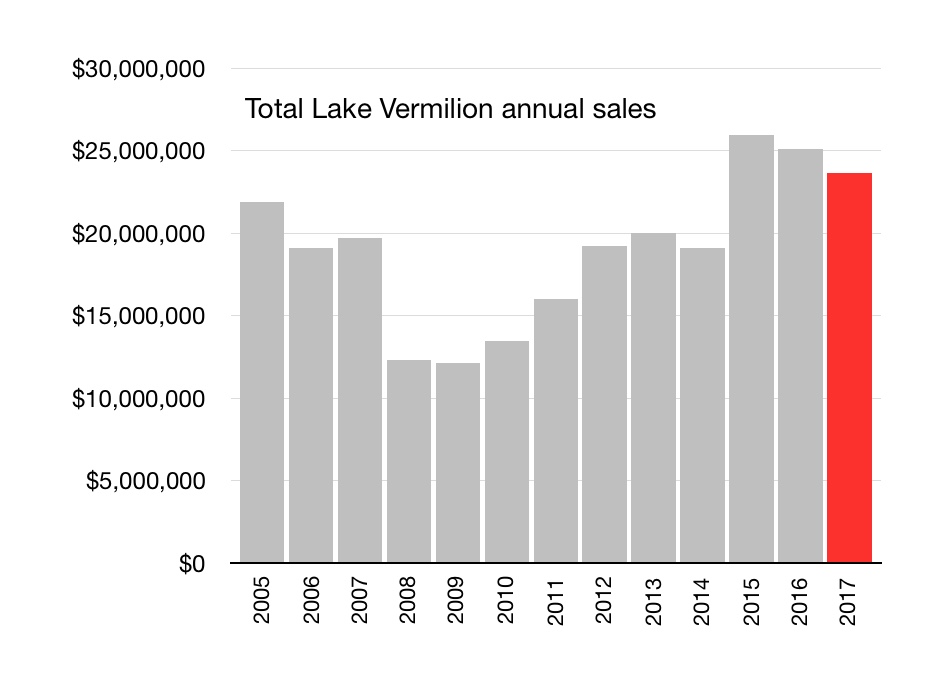
Comparative Lake Vermilion YTD Sales (Through The 3rd Quarter Of 2018)

October 8, 2018

We’re now at the nine month milepost for the 2018 Lake Vermilion real estate market.

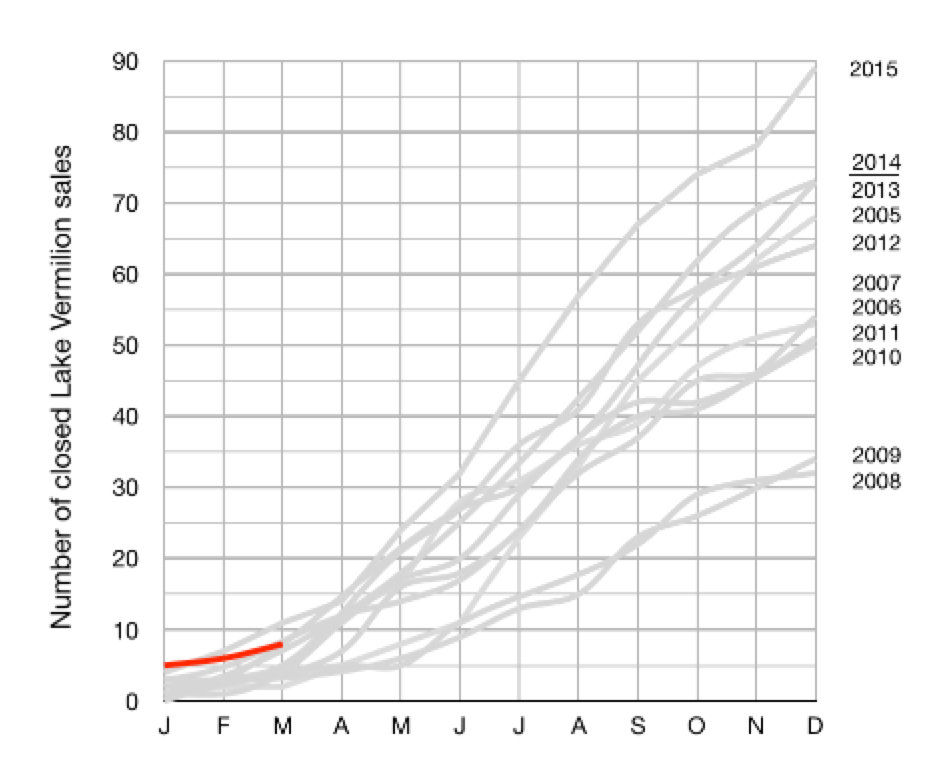
As is nearly predicable, the early months of the second half of the selling season produce a larger number of closed sales.  2018 ramped up to stay on par with the activity level of the previous several years.

To match the break out years of 2015 and 2016 and additional 30+ closed transactions are needed.  At this point of the selling season that seems unlikely.

The current number of pending sales would suggest overall sales for 2018 will be similar to 2017.

Weather conditions have a stronger influence on sales activity in late summer and early fall.  Recent cool and wet conditions (with a glimpse or two of snow) are not welcome factors for active sellers.  Smart buyers will “bundle up” and use this time of year to their advantage.

Stay tuned.

(As always, the grey lines show previous years and the red line represents current year data.)

(All data was sourced from the Range Multiple Listing Service.)

Comparative Lake Vermilion YTD Sales (First Half 2018)

July 23, 2018

We’re half way through the 2018 calendar year and at the selling season mid-point for the Lake Vermilion area real estate market.

Mid summer sale totals are not necessarily a great indicator of the final calendar year market performance.  This mostly recreational market typically logs more completed sales in the second half of the selling season.

Having noted that and as is obvious in this edition of the graph… year to date 2018 is lagging behind other recent years.  However, it appears mid summer activity has increased to the point where lost ground may be regained in the next few months.

Stay tuned.

(As always, the grey lines show previous years and the red line represents 2018 data.)

(All data was sourced from the Range Multiple Listing Service.)

Comparative Lake Vermilion YTD Sales (Final 2017)

January 8, 2018

Lake Vermilion real estate market sales for the 2017 calendar year finished a distant third to the previous two calendar years.

The brisk mid year sales gave way to a significant end of year fade into the stretch which resulted in a final  2017 completed sale count of 75 transactions.

The total dollar amount for sales in 2017 was $23,661,600.  The average sales amount for that group was $315,488.

I added three graphs to show additional historical market comparisons.  Let me know if you have any questions or if you would like more information.

(As always, the grey lines show previous years and the red line represents 2017 data.)

(All data was sourced from the Range Multiple Listing Service.)

Comparative Lake Vermilion YTD Sales (through the first half of 2017)

July 31, 2017

Completed Lake Vermilion real estate market sales through June in the 2017 calendar year have been pretty respectable.

It is the second half of the year that will determine if this waterfront property market can remain strong with a finish comparable to the previous four years.

The total dollar amount for sales in the first 6 months of 2017 was $7,997,500.  The average sales amount for that group was $285,625.

If you have an interest… I am also happy to provide additional information on the Lake Vermilion real estate market.

(As always, the grey lines show previous years and the red line represents the 2017 YTD sales.)

(All data was sourced from the Range Multiple Listing Service.)

Comparative Lake Vermilion YTD Sales (Final 2016)

February 13, 2017

2016 brought strong historical sales within the Lake Vermilion real estate market.

We did not eclipse the 2015 calendar year for the total number of completed sales (89 versus 85 closed sales) but let’s say we made up for the short fall with extra style points for very linear sales progress throughout the entire 12 months.

The total dollar amount for Lake Vermilion sales in calendar year 2016 was $25,081,550. That’s very comparable to the 2015 total of $25,611,050.  The average sales amount for the 2016 group was $295,077.  That’s an increase of $7,313 from the 2015 average of $287,764. The overall sales price range for 2016 was $21,500 to $1,450,000.

Please let me know if you have any questions related to these details.  I am also happy to provide additional information on the Lake Vermilion real estate market.

(As always, the grey lines show previous years and the red line represents 2016 completed sales.)

(All data was sourced from the Range Multiple Listing Service.)

Comparative Lake Vermilion YTD Sales (Through The First 7 Months Of 2016).

August 5, 2016

With 7 months of 2016 behind us and half of the local selling season in the books, here’s evidence of a very smooth and gradual increase in activity and completed sales within the Lake Vermilion real estate market.

I would predict that final sales in this calendar year will be very good but will not eclipse the results from last year.  Time will tell.

Please let me know if you have any questions related to these details.  I am also happy to provide additional information on the Lake Vermilion real estate market.

(As always, the grey lines show previous years and the red line represents the current year sales.)
July-2016-LV-YTD-sales
(All data was sourced from the Range Multiple Listing Service.)

Comparative Lake Vermilion YTD Sales (Through The First 3 Months Of 2016).

April 25, 2016

It may be too optimistic to expect a 2015 level of sales from 2016.  And… it is way too premature to offer a prediction for the remaining 9 months of the year. This second home market weighted market just starts to gain traction in the 2nd quarter.

So… stay tuned for market updates in we progress into the summer months.

Please let me know if you have any questions related to these details.  I am also happy to provide additional information on the Lake Vermilion real estate market.

(As always, the grey lines show previous years and the red line represents the current year sales.)
March-2016-LV-YTD-sales5
(All data was sourced from the Range Multiple Listing Service.)

Comparative Lake Vermilion YTD Sales (Final 2015)

January 4, 2016

Boom!

2015 was a bit of a break out year for the Lake Vermilion real estate market.  The total of completed sales increased to 89 from the previous 2014 high of 73.

That’s a whopping 22% increase from last year!

The total dollar amount for Lake Vermilion sales in calendar year 2015 is $25,611,050.  That’s an increase of $6,509,343 from the 2014 total of $19,101,707.  The average sales amount for that group was $287,764.  That’s an increase of $26,097 from the 2014 average of $261,667.  The overall sales price range for 2015  was $35,000 to $850,000.  That range for 2014 was $8,000 to $1,200,000.

Please let me know if you have any questions related to these details.  I am also happy to provide additional information on the Lake Vermilion real estate market.

Happy New Year!  May 2016 be happy, healthy, and prosperous for all!

(As always, the grey lines show previous years and the red line represents 2015 completed sales.)

(All data was sourced from the Range Multiple Listing Service.)

Comparative Lake Vermilion YTD Sales (Through The First 8 Months Of 2015).

September 11, 2015

It certainly looks like we’re headed for a break out year in the Lake Vermilion area real estate market!

As the chart shows, 2015 will, most likely, produce significantly more completed sales than any of the previous 10 years.

Numerous factors may contribute to this healthy market… stabilizing values, low interest rates, an active buyer pool, and engaged sellers.  And, of course, the ongoing and undeniable fact that Lake Vermilion is a beautiful place to live, work, or play.

The remainder of the year should show continued market strength.  I may have to to extend the chart scale to accommodate the final numbers.

As always, please let me know if you have any questions related to this information.  I am also happy to provide additional details on the Lake Vermilion real estate market.

(The grey lines show previous years and the red line represents 2015 completed sales.)

August-2015-LV-YTD-sales(All data was sourced from the Range Multiple Listing Service.)

Comparative Lake Vermilion YTD Sales (Through The First 5 Months Of 2015).

June 1, 2015

It’s about time to see how 2015 year to date Lake Vermilion sales are stacking up against previous years.

As the chart reveals, the first five months have been very good.  A strong month of May pushed the closed sales total to a YTD record!

Also, a quick glimpse at the trusty Range MLS data would indicate continued strength with a strong number of pending sales.

Please let me know if you have any questions related to these details.  I am also happy to provide additional information on the Lake Vermilion real estate market.

(As always, the grey lines show previous years and the red line represents 2015 completed sales.)

May-2015-LV-YTD-sales(All data was sourced from the Range Multiple Listing Service.)

« Newer PostsOlder Posts »