 Bill Tibbetts
Associate Broker
Bill Tibbetts
Associate Broker 
October 16, 2009
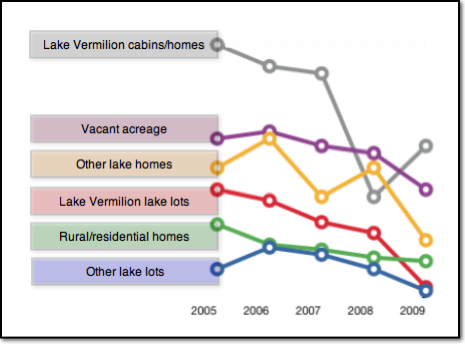
Comparative YTD (October 15th) Sales Activity 2005-2009
I thought the mid-month market update could use a little color so here’s a graph to help us see how current market activity compares to previous years in six specific property categories. Please note that each of the six trends have no relationship to each other. View each category as a indication of how the current year-to-date sales compare, within that group, to the four previous years.
I would highlight the following:
1) Lake Vermilion cabins/homes- The most dramatic drop in sold properties since 2005 but also the largest rebound since last year.
2) Vacant acreage- Not a huge reduction is overall activity. The poorest year, however, is 2009.
3) Other lake homes- Most erratic of the group somewhat attributed to the fact that this is not a category that produces a comparatively large number of sales.
4) Lake Vermilion lake lots- A steady downward trend with 2009, to date, showing a very poor sales year.
5) Rural/residential homes- The most stable of the group over the last four years.
6) Other lake lots- Similar to Lake Vermilion lake lots with 2009 activity at very low levels.
Comments? Questions?