 Bill Tibbetts
Associate Broker
Bill Tibbetts
Associate Broker 
October 19, 2009
More Charts.
For those of you who find value in statistics… please review the following:
This series of charts show the average selling price reductions for six property categories through mid-October from 2005 to 2009.
The information offers confirmation that pricing is related to sales activity. That become apparent to me when I compared each chart to the activity chart shown below. There’s a definite correlation. It’s kind for comforting to see the relationship but common sense would say it should be expected.
The lower line on each chart shows the average amount of reduction from the most recent asking price to the actual selling price. The top line shows the average amount of reduction from the original asking price to the actual selling price.
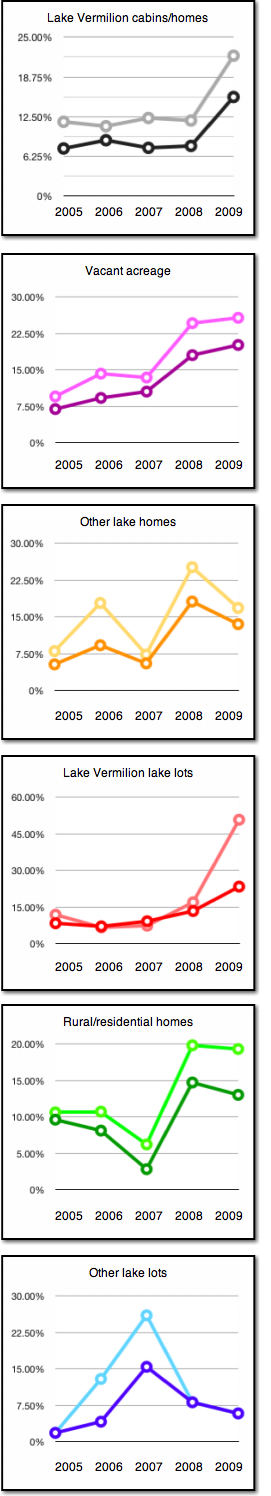 Lake Vermilion cabin and home sales have been trending below normal sales levels. But this category has had the largest uptick in activity to date this year.
This chart may indicate that this year’s increased activity is due to price adjustments by the sellers or/and more aggressive offers by the buyers.
Vacant acreage sales activity remains in a downward trend. Sellers have adapted with continued price reductions since 2005.
The chart may indicate that seller adjustments are leveling off.
Other lake homes (other than Lake Vermilion) is a category that does not produce much data due to fewer listing numbers. This chart offers a very similar trend to the activity trend shown in the activity chart below.
That would seem to indicate that sales activity is related to price adjustments.
Lake Vermilion lake lots is also a category that does not produce a large amount of information. Lake Vermilion has historically not offered a large number of undeveloped lots for the buyer.
That may explain why this trend is relatively flat and near the 10% reduction range up until this year. (The 2009 data point should not be considered valid. The 2009 activity level is not high enough to produce a believable trend.)
Rural/residential homes does offer a more substantial group of information and should be a good indicator of how sellers are reacting to the market.
This trend may suggest that seller adjustments are moderating.
Other lake lots (other than Lake Vermilion) also shows that undeveloped lakeshore lots have sales activity with relatively lower price adjustments.
Questions? Comments?