 Bill Tibbetts
Associate Broker
Bill Tibbetts
Associate Broker 
Comparative Lake Vermilion YTD Sales (Final 2020)
January 19, 2021
I have to put an asterisk on the year 2020*. I think it’s safe to say 2020* be will asterisk heavy for all of time… for numerous widely known reasons.
Look at this 2020* year end graph (see below).
As is obvious, 2020* broke all previous real estate activity records in the Lake Vermilion market. Land, cabin and home properties were snapped up by anxious buyers who, apparently, were largely driven by the attraction of an up north refuge removed from the pandemic, politics, and other people.
Here are the numbers:
The 2020* Lake Vermilion market logged a total of 101 total sales (that’s +12 from 2015 and +16 from 2016). The total dollar amount sold was $37,379,550 (+$12,901,868 from 2019) with an average sale amount of $370,094 (+$25,338 from 2019). (These numbers include sales for all property types… homes, cabins, year round, seasonal, vacant lots, road access, water access.)
This increased activity pushed a market that, for several years, has not significantly favored buyer or seller to a market with a seller advantage. Increased buyer activity reduced the pressure for sellers to negotiate pricing. The inventory of active Lake Vermilion listings eroded throughout the calendar year to where, at this point in time, inventory numbers are at very low historical levels.
In my post from one year ago (see below) I got one 2020* expectation wrong and one right:
“The buyer and seller mix and level of motivation on both sides should remain mostly balanced with no significant change expected in seller inventory or buyer interest.” WRONG.
“As always, larger factors on the state, national or global stage may come into play.” RIGHT.
Again, as a teaser for the coming 2021 market… January 2021, to date, has produced 9 completed and pending sales. We’ll have to see if that strong start continues throughout the year.
Stay safe. See you on the lake.
(As with all previous graphs, the grey lines show prior years and the red line represents 2020 data.)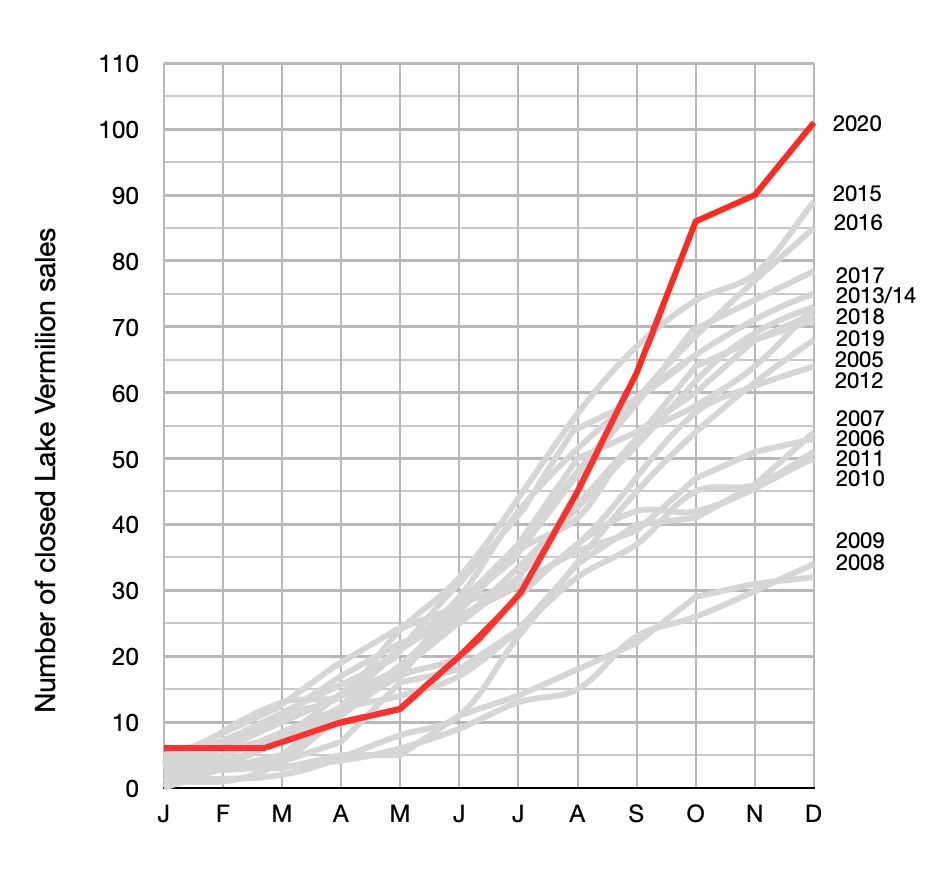 (All data was sourced from the Range Multiple Listing Service.)
2020* = 2020