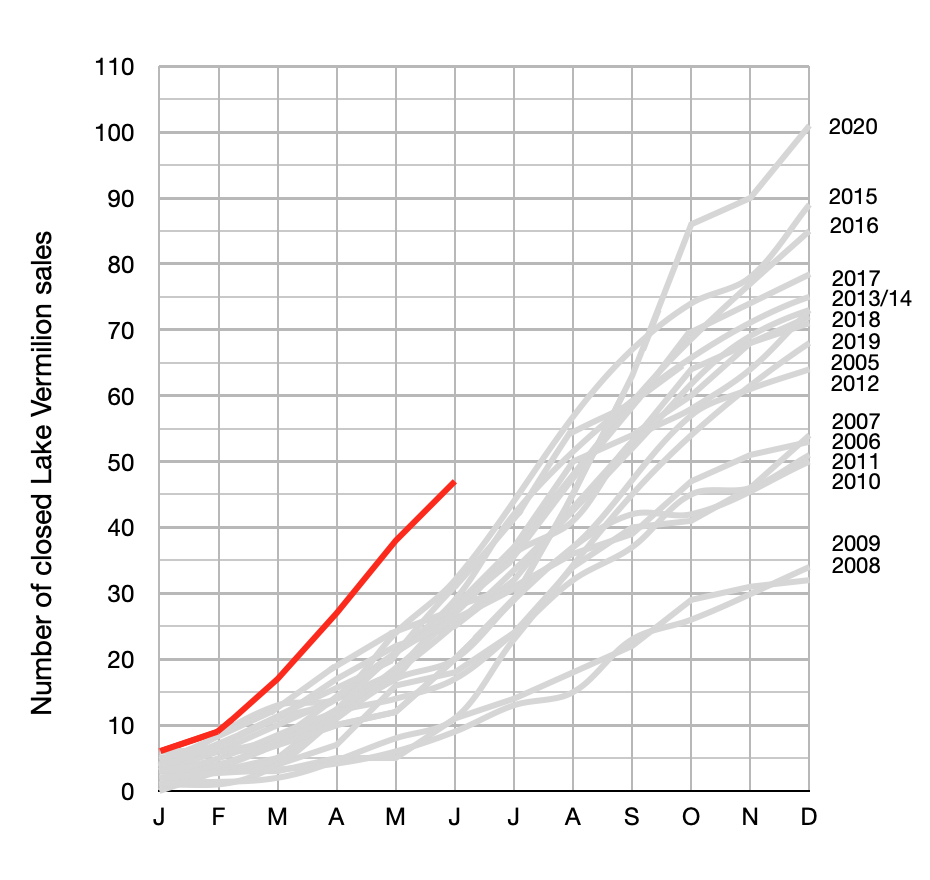
Comparative Lake Vermilion YTD Sales (First Half 2021)
August 2, 2021
As is obvious in this latest graph, the enthusiasm seen in the Lake Vermilion real estate market in the second half of 2020 has continued into the first half of 2021.
There were 47 completed sales (all property types) through June with an average selling price of $283,376. The selling price range was from $34,000 to $1,250,000. The average “days on market” for that group was 223 days.
There is plenty of general real estate conversation about a “seller oriented market”. Indications of this imbalance include low inventory, immediate multiple offers for newly listed properties and final selling prices above the advertised listing price. Curiously, the 47 sales to date in the 2021 Lake Vermilion market included only 4 sales above the most recent asking price and only 8 sales at the most recent asking price. All other sales were below asking price.
The second half of 2021 will see the impact of low inventory levels with active buyers unable to act due to a smaller than typical listing selection. (Completed sales in July 2021 are more inline with historical numbers.)
Please let me know if you have any questions or comments with this information. Thanks for your time.
(As always, the grey lines show previous years and the red line represents 2021 data.) (All data was sourced from the Range Multiple Listing Service.)
 Bill Tibbetts
Associate Broker


