 Bill Tibbetts
Associate Broker
Bill Tibbetts
Associate Broker 
Comparative Lake Vermilion YTD Sales (First Half 2022)
August 18, 2022
Twelve months ago I used the word “enthusiasm” to describe the Lake Vermilion real estate market through the first half of the year.
This current graph might lead one to conclude that “enthusiasm” would be an inappropriate descriptor for YTD 2022. However, the “don’t jump to conclusions” adage might be applied here.
I would suggest that, through July 2022, overall buyer enthusiasm was present only to be throttled by the restriction of unusually low available inventory levels (which is revealed in the reduced number of closed sales).
Comparing Lake Vermilion (all property types) YTD 2021 versus 2022 shows the following:
- Completed sales – 47 sales versus 28 sales
- Average selling price – $283,376 versus $426,339 (Median selling price = $235,309 versus $285,250)
- Average days on market – 223 days versus 273 days
- Closed sales above asking price – 4 sales versus 8 sales (8.5% versus 28.5%)
- Closed sales at the asking price – 8 sales versus 4 sales (17% versus 14.2%)
- Closed sales below the asking price – 35 sales versus 16 sales (74.4% versus 57.1%)
The market performance for the second half of 2022 is a tough prediction.
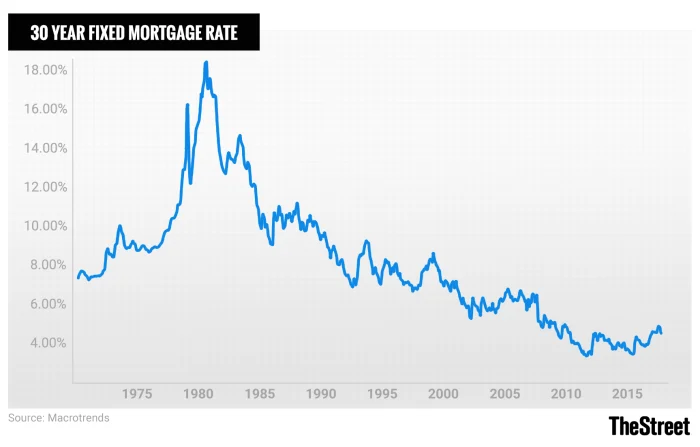
Factors contributing to overall activity will include over all economic performance and perception, mortgage rates (recently higher but historically very low), and, of course, the inventory of available properties.
Please let me know if you would like additional details on this information. Thanks much.

(As always, the grey lines show previous years and the red line represents 2022 data.) (All data was sourced from the Range Multiple Listing Service.)


