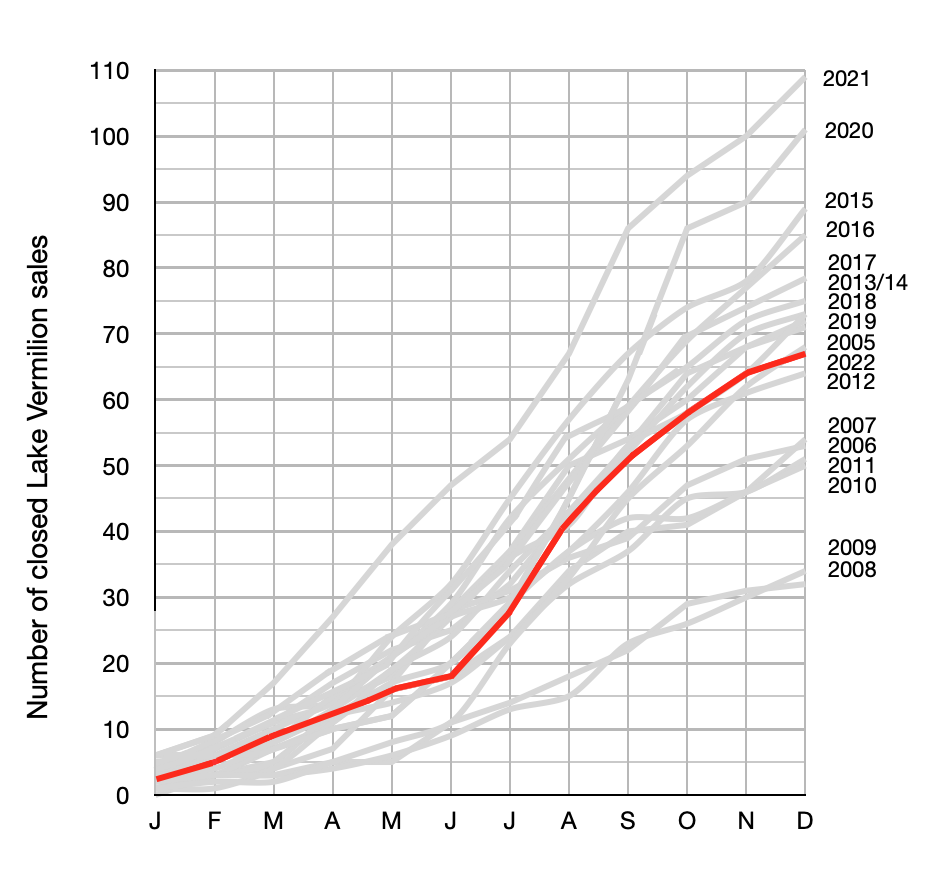
Comparative Lake Vermilion YTD Sales (Final 2022)
February 9, 2023
As first glance, 2022 might appear as an under performing market year for the Lake Vermilion market, especially if compared to the previous 2 years (2022 and 2021). However, as the graph might suggest, 2022 was more of a typical year in terms of completed total sales. 2022 saw 67 completed Lake Vermilion transactions.
Buyer enthusiasm seemed to be in place throughout the 12 months of 2022. And sellers with decent offerings priced at reasonable asking prices did, for the most part, find willing buyers.
However, as mentioned and suggested in the mid-year post, the most significant limiting factor in the final sales number was, most likely, the amount of available inventory.
As shown in the following numbers… the average selling price was up, the time to sell was flat, and most sales were below the asking price (although in most of these transactions the final agreed upon price was just slightly below the asking price).
Comparing Lake Vermilion (all property types) Final 2021 versus Final 2022 shows the following:
- Completed sales – 109 sales versus 67 sales
- Average selling price – $387,401 versus $433,173 (Median selling price = $300,000 versus $345,000)
- Average days on market – 186 days versus 183 days
- Closed sales above asking price – 11 sales versus 16 sales (10.0% versus 23.8%)
- Closed sales at the asking price – 16 sales versus 7 sales (14.6% versus 10.4%)
- Closed sales below the asking price – 82 sales versus 46 sales (75.2% versus 68.6%)
So… what can be expected in the 2023 Lake Vermilion market? I believe the amount of available inventory will, again, have the biggest impact on market activity. If inventory remains low and buyer interest remains solid, sellers may benefit with a continuing upward trend in market values. The number of successful transactions will be determined by how many buyers find an acceptable offering from a lower number of available properties.
Please let me know if you would like additional details on this information. Thanks much.

(As always, the grey lines show previous years and the red line represents 2022 data.) (All data was sourced from the Range Multiple Listing Service.)
 Bill Tibbetts
Associate Broker


