A daily journal concerning Lake Vermilion and surrounding areas.
Selected real estate, notes, stories, musings, and anecdotes.

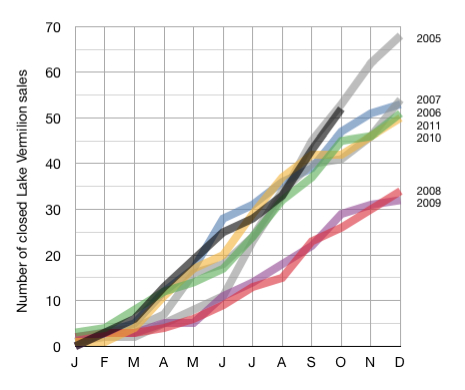
Comparative Lake Vermilion YTD Sales Through October.

November 10, 2012

Here’s the October monthly installment for year to date completed real estate sales on Lake Vermilion.

(The black line represents 2012 year to date completed sales.)

October was another nice month for the Lake Vermilion real estate market.

Obviously, 2005 is the year to beat.  But that particular year provided a steroid-enabled-like end of year performance that may be tough to match.  Regardless of the final outcome, 2012 will easily qualify as a recovery year for the Lake Vermilion real estate market.

More to come.  Stop back.

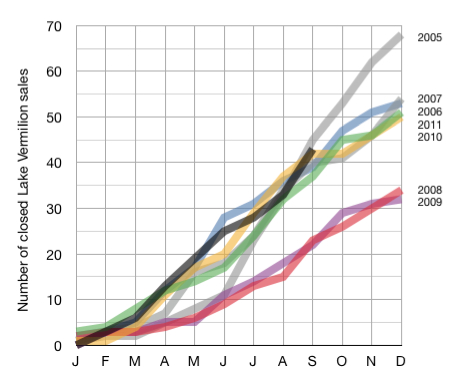
Comparative Lake Vermilion YTD Sales Through September.

October 10, 2012

Here’s the September monthly installment for year to date completed real estate sales on Lake Vermilion.

(The black line represents 2012 year to date completed sales.)

September was a nice month for the Lake Vermilion real estate market.

2012 is now outperforming all years back through 2005 except for 2005.  We’re at that time of the calendar year where weather can become a factor in real estate activity.  A mild Fall might push 2012 to a strong 2005-like fourth quarter finish.

As always… stay tuned.

Comparative Lake Vermilion YTD Sales Through August.

September 6, 2012

Here’s the August monthly installment for year to date completed real estate sales on Lake Vermilion.

(As always, year to date sales for 2012 are represented by the shorter black line.)

Well, it looks like we’re holding our own.  We’re running with the previous contenders at the mid-point of the selling season.

It is a bit of a curiosity that the sales rate throughout the calendar year is fairly linear. That’s especially true for the group of 2006, 2007, 2010, and 2011. Maybe we’ll finish close to that group or maybe we’ll have a strong Fall season and challenge 2005.

As always… stay tuned.

(Also, I can’t believe I only had two lousy posts in August.  Curse of the deja vu.)

A Short List.

August 23, 2012

Here’s a quick note and a short list of semi-post quality items:

 The overall inventory of lakeshore properties has been at a reduced level this year (2012) when compared to recent years.  The cabins and homes category shows the most obvious reduction.  New listings, properly prepared for the current market, seem to attract buyer interest shortly after they are made available.

 Properties with long “on the market” times have seen improved sales.  For recently sold undeveloped lake lots, the average time on market (per the local MLS System) is 1010 days.  For recently sold lake cabins and homes, the average time on market is 399 days.  (Both figures are YTD 2012.)

 To date in 2012, I have arranged and completed numerous listing tours in the Lake Vermilion area.  It is of some concern that 17 of those tours did not produce a sale, offer, or, in some cases, any attempt to courteously end the experience.  (That’s probably not a significant or worthy statistic but at least I feel better.)

Comparative Lake Vermilion YTD Sales Through July.

August 7, 2012

Here’s the July monthly installment for year to date completed real estate sales on Lake Vermilion.

(As always, year to date sales for 2012 are represented by the shorter black line on the bottom left of the graph.)

July 2012 hit on less than all cylinders and the result brought us to a 2010 performance level.  It would have been nice to see a bump in the positive direction but, at this point in time,  I would not consider this to be the start of a trend adjustment.

We’ve had a very nice Summer season with many residents and visitors enjoying all the lake area has to offer.  A mild mid-Summer slump in sales activity is not surprising.  Let’s see if 2012 can stay in the running as a rebound year.

As always… stay tuned.

Personal Challenge.

July 20, 2012

Will the person who found this website by searching with the phrase “outhouse knob“, please contact me.

I would like to determine how many degrees of separation there are between your current status and lake property ownership.

Thanks much.

Question Du Jour.

July 11, 2012

Here is a common summer time inquiry in lake country…

“Do I need a permit for my dock?”

You can find the answer by clicking here.

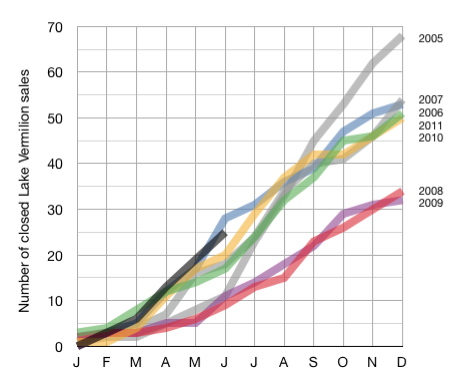
Comparative Lake Vermilion YTD Sales Through June.

July 5, 2012

Here’s the June monthly installment for year to date completed real estate sales on Lake Vermilion.

(Year to date sales for 2012 are represented by the shorter black line on the bottom left of the graph.)

2012 is running a good race at this half way point of the contest.  2012 may have slipped into second place behind 2006 but 2006’s early season sprint is about to run out of gas.

2005 will eventually be the year to catch.  That’s going to be a very tall order.  I think it would be encouraging, and maybe a little overly optimistic, to have 2012 continue at a pace to finish somewhere between 2005 and 2007.  We’ll see.

As always… stay tuned.

A Little Off The Top.

June 28, 2012

Here’s a graph to confirm an unsurprising fact.

At this writing, there are 109 cabins and homes (road and water access) offered for sale on Lake Vermilion.  This chart shows the current asking price (grey line) and the corresponding original asking price (red line) for individual properties priced from $100,000 to $1,000,000.  (Information sourced from the Range MLS data.)

1) Obviously, Sellers continue to offer price adjustments to attract Buyers.  2) Aged listings will, typically, have a greater degree of asking price adjustment.  Most newly listed properties will reflect pricing adjusted to changing market conditions.  3) The remainder of the story is revealed after the final selling price is established.

The Best Lakes Contain Water.

June 14, 2012

It’s raining.

“So what!”…you might think.  Well, not so many weeks ago, the extended lack of rainfall/snowfall was made very evident by the water level of the lake.  We were in an elevated drought status with dry soils and an unusually low lake water level.  However, over the last several weeks, we have had an ample amount of local precipitation.  The additional rainfall has allowed for a Lake Vermilion water level recovery.  To confirm, you can view the  DNR trend here (click on the graph to see the details).

It’s interesting to also note the water levels on other Minnesota lakes.  Leech Lake, Winnibigoshish, and Cass Lake have similar patterns to Lake Vermilion.  Lake Mille Lacs has had a longer sustained downward pattern.  The trend on Lake of the Woods is very stable.  Lake Minnetonka also has a similar pattern to Lake Vermilion but with a wider water level range of 8+ feet (versus Lake Vermilion’s 3 1/4 feet).

Water… it’s what makes a lake.

Update:  Some areas in NE Minnesota are getting way too much rain.

« Newer PostsOlder Posts »